SIGNAL
G. Schuhfried © SCHUHFRIED GmbH
Application
Assessment of long-term focused attention. The test measures the visual differentiation of a relevant signal within irrelevant signals. It is suitable for use with individuals from seven years of age.
Theoretical background
Signal discovery theory (synonymous with the signal detection theory of Green and Swets, 1966) describes the perception of weak signals against a constantly changing (”noisy”) background. It is not concerned only with the visual differentiation of signals of a particular type that are close to the perception threshold. More generally it addresses the question: under what conditions can a person detect the presence of a weak signal against a background of irrelevant signals or among other signals that could sometimes be confused with the relevant signal? There is a close link here with statistical decision theory. The response ”signal present” or ”signal not present” is viewed not just as an issue of sensitivity to differences but mainly as a decision-making problem; the testee must decide between two possible responses, to which different probabilities attach.
Administration
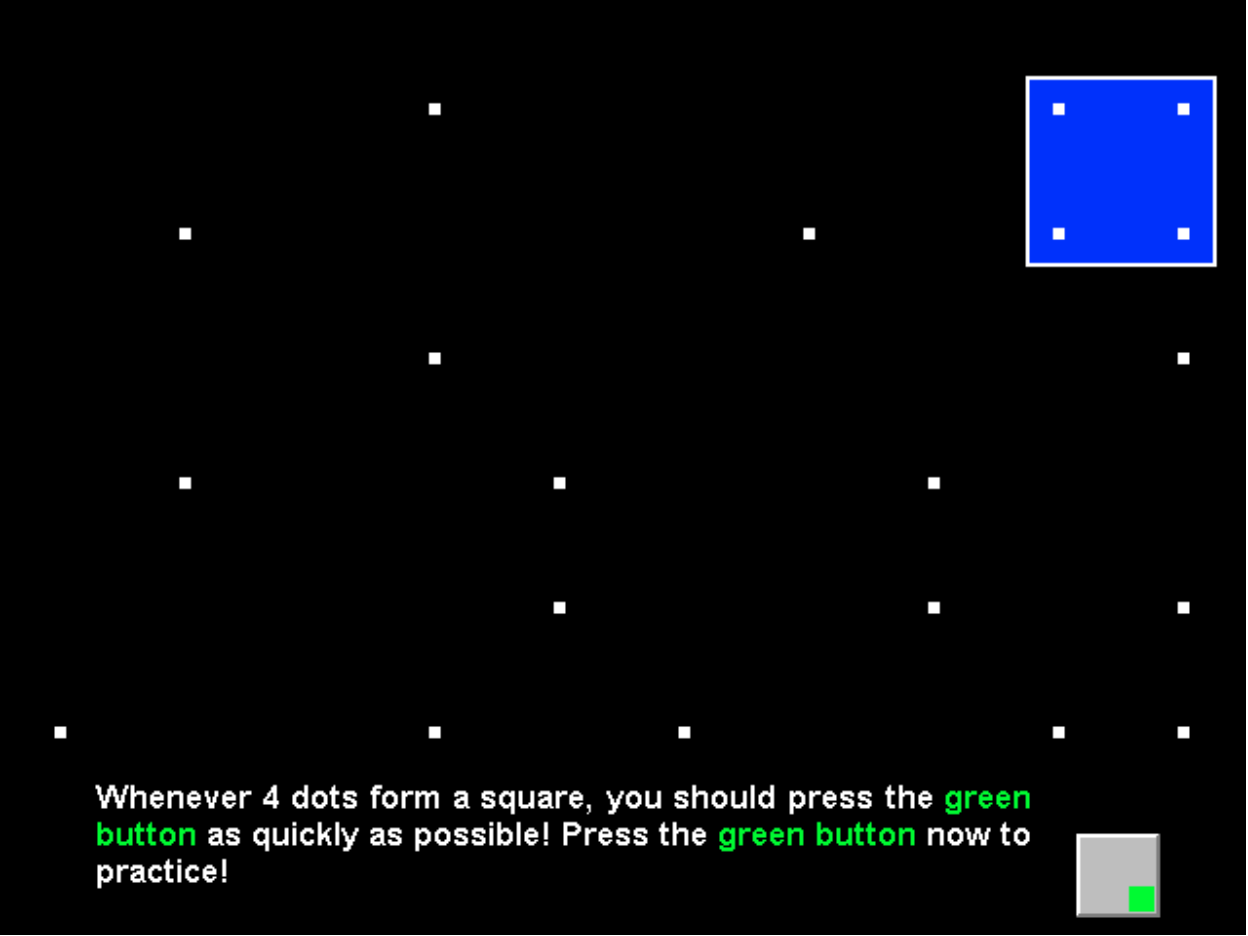
Dots are displayed over the entire screen area; pseudo-randomly, some of the dots disappear and others come into view. The critical stimulus constellation consists of four dots forming a square. Whenever this stimulus appears, the testee must respond by pressing a button.
Test forms
- S1: Standard (white signals on a black background)
- S2: Standard, inverted (black signals on a white background)
- S3: Short signal duration
- S4: Signal balance (neglect assessment)
Scoring
The main variables calculated are the numbers of correct, delayed and incorrect reactions as a measure of the reliability of the detection process, and the median detection time as a measure of the speed of the detection process.
Reliability
In Form S1 the reliability of the sum of c orrect and delayed responses and the reliability of median detection time was estimated using Guttman’s λ2. This yielded values of 0.78 for the sum of correct and delayed responses and 0.8 for median detection time. For the variable “total correct and delayed reactions” split-half reliability coefficients (odd-even method) of between r=0.74 and r=0.85 were obtained, depending on the test form and the comparison sample. For the median detection time the reliability calculated by the same method was between r=0.78 and r=0.84.
Validity
Construct validity can be assumed because the aspects of performance measured constitute the criteria for the construct of signal detection in accordance with signal detection theory. Studies with extreme groups also yielded very good results.
Norms
For test forms S1 to S3 norm samples of between N=76 to N=1,023 are available. In some cases the norms are also available partitioned by gender, age and education. For Form S4 norms are available for N=71 neurological patients.
Time required for the test
Approx. 14–20 minutes (including instruction and practice phase).